Today I am going to explore the correlation between Perth metro fuel prices and the oil prices.
The chart below is a live Power BI report showing:
- the daily average retail price of unleaded (ULP) fuel in Perth metro (the dark green line),
- the 7-day moving average retail price of unleaded (ULP) fuel in Perth metro (the light green line),
- the daily average of wholesale price of unleaded (ULP) fuel in Perth metro (the dotted yellow line),
- the daily Brent oil price converted in AUD (the blue line)..
Below there is a screenshot of this report for the calendar year 2019 as at 26 June 2019.

Looking at the curves of thee moving average of retail unleaded price and the daily Brent oil price, there is an obvious – and quite frankly expected – correlation between the two of them. There is also a good correlation between the wholesale price and the oil price. However how strong are these correlations?
Correlation coefficient
I computed in Power BI the Pearson correlation coefficients between these prices over a period nearly two years from November 2017 to June 2019:
- 0.92 correlation between the daily average wholesale price and the oil price,
- 0.68 correlation between the moving average retail price and the oil price.
Note that for retail prices I used the moving average over a 7 day period to remove the noise from Perth weekly prices variations. See my post Perth fuel price are cheap on Mondays and shocking on Tuesdays.
For the wholesale price the correlation is very strong (close to 1).
For the retail price there is a material correlation as the Pearson coefficient is 0.68 however it is not close to 1.
It makes sense that the correlation of the oil price with the wholesale price is higher than with the retail price. Actually, the retail margins of fuel stations are prone to daily variations which weakens the correlation with the oil price.
Adjusting the correlation for time difference
Also, by looking more closely at the curves, it is obvious that fuel prices follow the oil price with a couple of days difference. I created a new Power Bi measure to compute the correlation coefficient adjusted by a time difference in order to perform some sensitivity analysis.
The chart below is a live Power BI report showing how the correlations varies when adjusted by timing difference (in days on the X axis).
Below there is a screenshot of this report as at 25 June 2019.

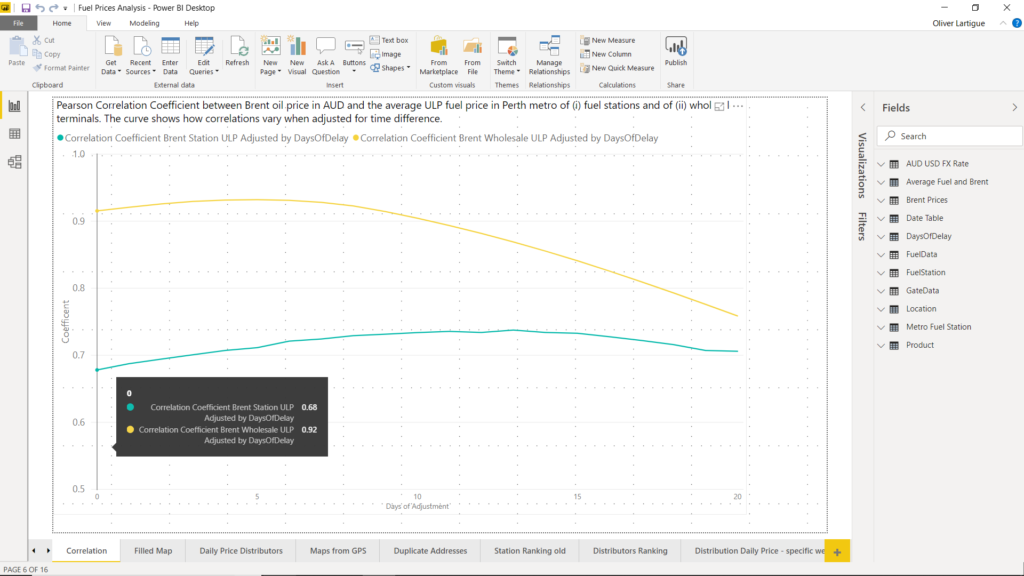
There is a very good correlation between wholesale fuel price and oil price
For the wholesale price, the correlation coefficient hovers between 0.92 and 0.93 with a time difference between 0 and 8 days. The Person correlation coefficient peaks at 0.93 when the fuel prices are brought backward by 5 days.
0.93 is a very high coefficient, meaning that wholesale fuel prices are almost entirely explained by oil prices. Other factors could be variations in refining margin and transport costs.
Retail unleaded fuel prices lag oil prices by 2 weeks
For fuel retail prices the strongest correlation coefficient is 0.74 when the fuel prices are brought backward by 13 days. 0.74 is a high coefficient however not close to 1, meaning that oil prices account only partially for the movement in fuel prices. As a reminder the correlation is with the 7-day moving average, so the weekly seasonality has already been removed from the equation. Other factors have to play a role in setting retail fuel prices, this could be retail margin, refining margin…
The most interesting insight is that Perth retail unleaded fuel prices lag oil prices by approximately two weeks.
What surprised me is that correlations do not peak for the same time difference: 5 days with wholesale vs. 13 days with retail. Any idea why?
Now that I know the correlation between retail prices and oil prices, let’s see if I could predict 2 weeks in advance Perth retail fuel prices. This will be the topic of a next post.

Pingback: Petrol Stations are increasing their margin during the Covid crisis - Jefe Finance